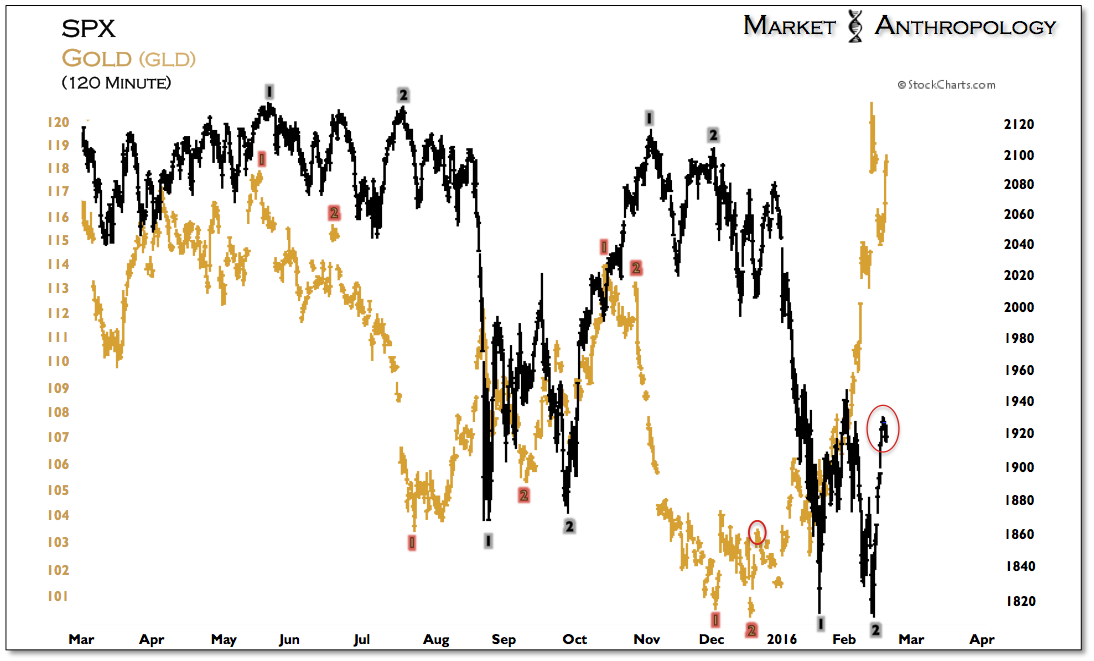
As the yellow metal surged more than 5 percent last week, gold fever quickly broke out and captured the emotions of both speculators and spectators alike. Leading the clarion charge from the stands after the rally was none other than the former big-league slugger and soothsaying market strategist, Jose Canseco – who in his (or his accountant/social media manager’s) own words, tweeted- “With gold minus storage cost becoming greater than cash returns could be a long rally.”
- Contemplative pause -
In a world more than ever flattened and converged in the discourse of ideas – both good and bad, who are we to deny the big man the public spectacle of pontificating on gold’s long-ball motivations? Granted, our thoughts on what fills gold’s sails here are a bit more nuanced, and perhaps not as succinct as Canseco appears to profess... But be that as it may, we’d frame it that as nominal yields fell sharply since the start of the year, inflation has fallen less. The net effect is that real yields (nominal yields minus inflation) have begun to fall – which historically is a sweet spot for gold to rally in.
This is the polar opposite dynamic of what transpired after the taper tantrum in May 2013, where nominal yields surged and inflation remained weak. And while St. Louis Fed President James Bullard (see here) recently raised concerns that long-term inflation expectations may be falling – as the five-year/five-year forward breakeven rate and oil might suggest; we tend to agree more with his southern colleagues in the Atlanta Fed who quickly refuted Bullard's anxieties the following day (see here) with a clear description of why breakevens have correlated so tightly with oil and why long-term inflation expectations have remained stable over the past year.
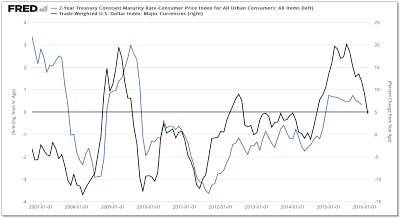
Looking back at the cycle for perspective, real yields began to rise shortly after the US dollar and short-term yields troughed in 2011, and began a correlated ascent over the next several years (Figure XX). As the dollar strengthened with short-term yields, assets like gold and commodities became highly unattractive as inflation turned down and shorter-term yields rose. This critical differential created a “virtuous” market environment that strongly favored equities, as disinflation is generally a welcomed condition for stocks by boosting growth and price/earning multiples and kryptonite for commodities as investors chase securities with actual yields.
That said – and as evident in the markets over the past year, a stronger dollar will eventually eat into profits of US corporations that do business overseas, as well as flame global anxieties through perceived capital imbalances that can reinforce the moves in the currency markets with often unwanted consequences. It is this reflexive market behavior that always poses significant risks, as trends can extend well beyond expectations – for both participants and the Fed.
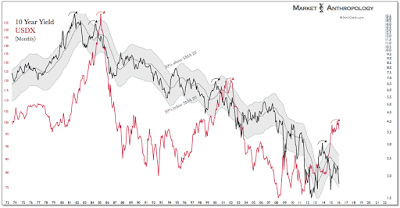
Keeping that in mind, we remain firmly in the camp that believes the best days for the dollar are in its past, despite heightened anxieties that there’s more to come from US dollar strength. Although the cyclical rise in the dollar culminated with a push to a relative performance extreme last year, the notion that the buck is under a more secular persuasion flies in the face of the long-term yield cycle, which continues to follow a proportional retracement decline that would indicate a lower for longer market environment - perhaps much longer than most would suspect . It remains our suspicion that until the next secular growth cycle commences and yields begin to rise, the dollar will continue to follow yields back into the trough of its own long-term cycle, which should engender another pulse of inflation to move through the system.
Ironically, despite the considerable uncertainty surrounding the financial markets this year, ultimately, a weaker dollar (i.e. rising inflation/falling real yields) could create the smoothest transition during this period of atypical policy normalization, where conventional methods of stabilizing the economy and markets are not readily available for the Fed - or as we've seen recently with the idea of negative interest rates, far too controversial to be reasonably effective.
Just this past week the Federal Reserve Bank of San Francisco – Chairwoman Yellen's old stomping ground, published an Economic Letter that ruminated on the idea that by allowing inflation to overshoot the Fed's 2 percent target, it would achieve the greatest decline in real interest yields and hence stabilize economic activity fastest.
Standard monetary theory states that the short-term nominal interest rate should be lowered to stimulate the economy whenever there is low inflation or economic slack—that is, when economic resources are not being fully used to their most efficient level. However, the nominal interest rate has a lower bound that is typically around zero. In theory, Eggertsson and Woodford (2003) showed that when the zero lower bound is binding, it is desirable to allow inflation to overshoot its target to promote a faster recovery in real economic activity.
At the heart of the Eggertsson-Woodford argument is the idea that economic slack increases with the real interest rate, which is the nominal short-term interest rate minus the expected future inflation rate. If prices and wages were able to adjust to economic conditions instantaneously then the economy would operate at its efficient level and there would be no economic slack. However, in normal conditions, prices and wages take some time to respond to changes in economic conditions, which leads to economic resources being underutilized. If this so-called economic slack is substantial—for example, following a financial crisis that restricts credit and pushes down consumption and investment spending—then according to the normal policy prescription policymakers would lower the short-term nominal interest rate. In turn, this would bring down the short-term real interest rate to stimulate the economy and reduce the slack. However, this policy prescription becomes ineffective if the nominal interest rate is at the zero lower bound. Because of this constraint, policymakers cannot engineer a decline in the short-term real interest rate to stabilize economic activity, and economic slack ends up larger than it would otherwise be. In other words, the real interest rate would still be too high. To make matters worse, elevated economic slack puts downward pressure on inflation and inflation expectations, which pushes the real interest rate up further, triggering even more slack.
Despite the zero lower bound, policymakers can still bring about a lower short-term real interest rate if they can generate higher inflation expectations. One way to do this is by communicating that the central bank intends to keep the nominal short-term interest rate low for longer than would otherwise be dictated by economic conditions; this has been a motivation behind the Federal Reserve’s forward guidance policy in recent years. Expecting a more expansionary monetary policy in the future should help boost future inflation and thus raise current inflation expectations, translating into a lower real short-term interest rate. Taking this theory a step further, by allowing future inflation to temporarily rise above target, the central bank can bring about a greater decline in the real interest rate and stabilize economic activity faster.-
Is There a Case for Inflation Overshooting?
Although the idea of loosening financial conditions through a weaker dollar and falling real yields flies under the radar of more conventional structural easing initiatives, we still believe it's the Fed’s best bet and most likely outcome – precisely because of their presumed reluctance to unwind the move off of ZIRP this past December. This doesn’t imply that we foresee US equities regaining the outperformance they held over the last several years - far from it – but that the idea that the Fed is left impotent here is greatly overstated. Moreover – and where the rubber meets the road for investors, their apparent recognition of these conditions reinforces the belief that assets like gold and silver that had fallen so far out of favor with rising real yields, will see another market environment blessed by the Fed that could generate significant returns.
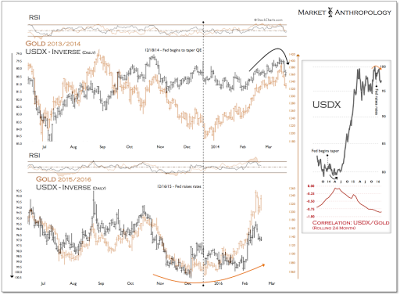
As we've described in the past, we follow and trade gold and silver not as harbingers of financial armageddon, but primarily as volatile proxies for commodities and inflation expectations. From our perspective, they are very much acting their partand leading commodities out of their respective cycle lows as the dollar begins to crack and real yields decline.
Gold took the pole position modestly over silver (+18.75% vs +16%) in their first leg up as global markets came under significant pressure. Being the higher beta asset, silver tends to either outperform or underperform gold based on speculative appetites of traders. Considering the broader market environment since the start of the year, silver has actually displayed relative resilience in our opinion. Our suspicion is that as markets get a better grasp on 1) the direction of the dollar, 2) the Fed, and 3) inflation expectations - risk appetites should gravitate towards the higher beta asset.
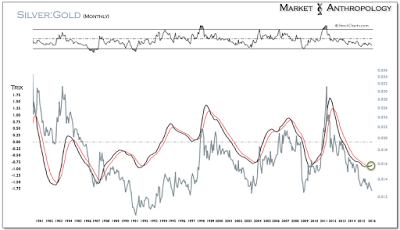
As we've shown in the past, the silver:gold ratio has been a leading indicator for major pivots in inflation expectations and the long-term chart of the ratio has been showing a positive momentum reversal over the past several months. While the reversal has yet to materialize in the ratio itself, it's not that surprising considering current market conditions. Longer-term, we expect silver to outperform, as long as the dollar continues to decline and global markets stabilize.
Taking a look at last weeks charts of our yen comparatives with gold, gold followed the move in the yen from the start of the year and explosively broke above its highs from last fall. And while the shine quickly came off by the start of trading this week, gold continues to follow the yen's lead by testing and perhaps expanding the range break. That said, should the pattern continue, a much larger shakeout potentially lies ahead before gold’s uptrend resumes. Based on the pattern in the yen, a move below this week’s low would point towards this outcome.
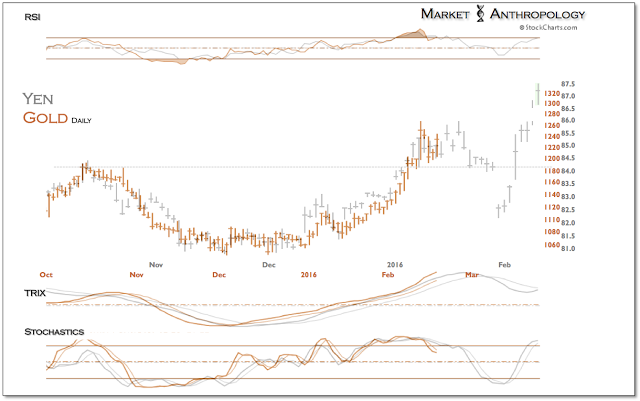
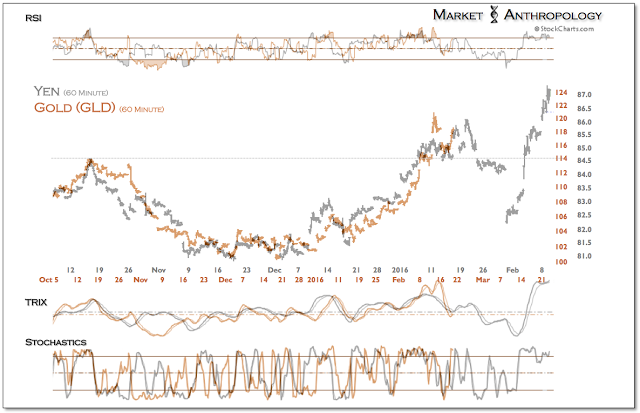
As always, for longer-term investors on the right side of the tracks, these prospective short-term moves are eventually rendered meaningless. The bigger picture read for us, is that as the virtuous disinflationary cycle turns down with equities here in the US, assets such as gold and silver that are tied to the direction of real yields - should once again outperform. And although equities continue to mirror the leading pivot structure of gold over the past several months, the wider-angle view tells a much bigger story – one the Canseco camp managed to boil down to under 144 characters.
